Grim and St. Denis was to devise a quasifractal diagram that represents all the possible games of tic-tac-toe. As everyone knows, tic-tac-toe is played on a 3-by-3 grid of squares by two players, X and O. Each player takes turns marking squares, and the first to get three in a row (across, down or diagonally) wins. Traditionally, X goes first, and optimal play always results in a draw. But exactly how many games are possible? At X�s first turn, he chooses among nine squares; then O chooses among eight, and so on. So the
total number of games is 9! = 9 x 8 x 7 x 6 x 5 x 4 x 3 x 2 x 1 = 362,880.
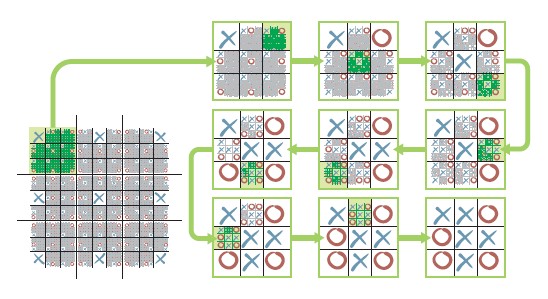
Here�s how Grim and St. Denis built their quasi-fractal. Start with a big 3-by-3
square grid, and divide each square into a 3-by-3 subgrid [see illustration on opposite
page]. Player X has nine opening moves, corresponding to the positions in the
larger grid. One possible move is that X chooses to mark the top left corner. Find
the 3-by-3 subgrid in the top left corner of the big grid and draw an X in the subgrid�s
top left corner. The subgrid is now a picture of the game after this opening move. Another possibility is that X opens with the bottom center square; to represent this move, find the subgrid in the bottom center square of the big grid and draw an X in the subgrid�s bottom center square. In this way, each of the nine subgrids receives an X in a different subsquare. Now concentrate on the subgrid in the top left corner of the big grid. X�s first
move is already drawn in the top left corner; the other eight subsquares represent possible moves for O. If we just put O�s in each of those subsquares, though, we would have nowhere to put X�s second move. Instead we repeat the trick already used for the opening move: We divide each of the eight unmarked subsquares into a 3-by-3 grid of sub-subsquares, getting eight small tic-tac-toe boards. We put an X in the top left corner of each, to represent X�s opening move. Then we put one of O�s eight possible moves into each of the small tic-tac-toe boards. We can continue in this fashion, recording all the possible moves in subgrids of ever smaller size. At every stage, all the unoccupied squares are subdivided into 3-by-3 grids, and all moves previous to that stage are copied into the cells of those grids. The final figure has a quasi-fractal structure because the rules of the game are recursive: the possible moves at each stage are determined by the moves made before. The geometry of fractals is also recursive: similar shapes repeat on ever smaller scales. The tic-tac-toe figure is a quasi-fractal rather than a true fractal because the game ends after a finite number of moves. Now we turn to logic. The simplest area of conventional mathematical logic, propositional calculus, is concerned with statements whose �truth-value� is either 1, representing true, or 0, representing false. For example, the statement P = �pigs can fly� has a truth-value of 0, whereas Q = �Africa is a continent� has a truth-value of 1. Statements can be combined using various logical operators, such as AND and OR. If P and Q are as above, the statement P AND Q is �pigs can fly, and Africa is a continent.� This statement is false, so the truth-value of P AND Q is 0. The results of applying AND to statements can be summed up in a truth table:
P Q P AND Q
0 0 0
0 1 0
1 0 0
It is also possible to change 0 to 1 and 1 to 0 by applying the operator NOT: that is, NOT P is true if P is false, and vice versa. There are 16 possible truth tables for two statements, representing all the possible ways to put 0�s and 1�s in the table�s final column. We can denote them with successive four-digit binary numbers: 0000, 0001, 0010, 0011 and so on, up to 1111. (In decimal notation, these numbers are 0, 1, 2, 3, ... , 15.) This list leads to another quasi-fractal. To draw it, sketch a 16-by-16 array of squares and add a border above the top row that identifies each column with one of the binary numbers [see illustration on page 86]. Then add a similar border down the left side of the array to enumerate the rows. Choose 16 different colors to correspond to the 16 binary numbers and color the border squares accordingly. Next, choose a logical operator: for example, the Sheffer stroke, which is represented by the symbol |. In computer engineering, the Sheffer stroke is known as NAND, because P | Q = NOT (P AND Q). Its truth table is:
P Q P | Q
0 0 1
0 1 1
1 0 1
1 1 0
Now, for each of the squares in the 16-by-16 array, put the square�s four-digit row number in the first column of the P | Q truth table and put the square�s column number in the table�s second column. Then perform the NAND operations and put the resulting truth-values in the table�s final column. This yields another four-digit binary number. Find the color that corresponds to this number and use it to mark the square in the 16-by-16 array. For instance, consider the square in row 5, column 11. In binary notation, these numbers are 0101 and 1011. Plugging them into the truth table for P | Q yields:
P Q P | Q
0 1 1
1 0 1
0 1 1
1 1 0
The number in the final column is 1110, or 14 in decimal notation. So the square in row 5, column 11 is given the color corresponding to 14. The final product of this laborious process is shown in the illustration. Notice that the green squares, corresponding to the binary number 1111, form a shape very similar to Sierpinski�s gasket! Instead of color-coding the picture, one can also graph the value of each square in a third dimension, as a height given by its decimal number divided by 16. For example, the height of the square in row 5, column 11 would be 14/16 =0.875. These graphs are called value solids. In the value solid for the Sheffer stroke, a gasketlike shape can clearly be seen. The explanation is simple: any formal logical system that involves recursion�whether a game or a truth table�can provide a recipe for drawing quasi-fractals.
11 comments:
you are about 19x smarter than me.
There are only 10 kinds of people in this world: Those who understand binary numbering systems and those who don't.
--Julian Franklin
www.Math-A-Magic.com
This like that t.v show numbers where the dude solves crimes with math.
Really cool site, I love math. I will be back!
very cool....thank you
You go through describing all this, and don't provide a picture? What's the deal?
is it mathematics??blur..
my head just exploded
You're under arrest for exploding Melanie's head. But I'm granting you amnesty for being so fractabulous.
nice blog
Combine the math of a fractal and the mathmatically indescribable form of a mobius loop and you have a technical poem from Lao Tzu about the Tao. I am surprised theoretical math nuts don't all become devoted Taoists. Keep on keepin' on.
Post a Comment